Exploratory Data Analysis
The Exploratory Data Analysis tab provides a statistical overview of your dataset and lets you explore individual columns through visualisations. It is the starting point for understanding your data before any preprocessing or mining begins.
Correlation Analysis
The Correlation Analysis section presents a correlation matrix showing how each numeric attribute relates to the others. This is useful for identifying potentially redundant or highly collinear columns that could be removed before mining to reduce noise and simplify the result set.
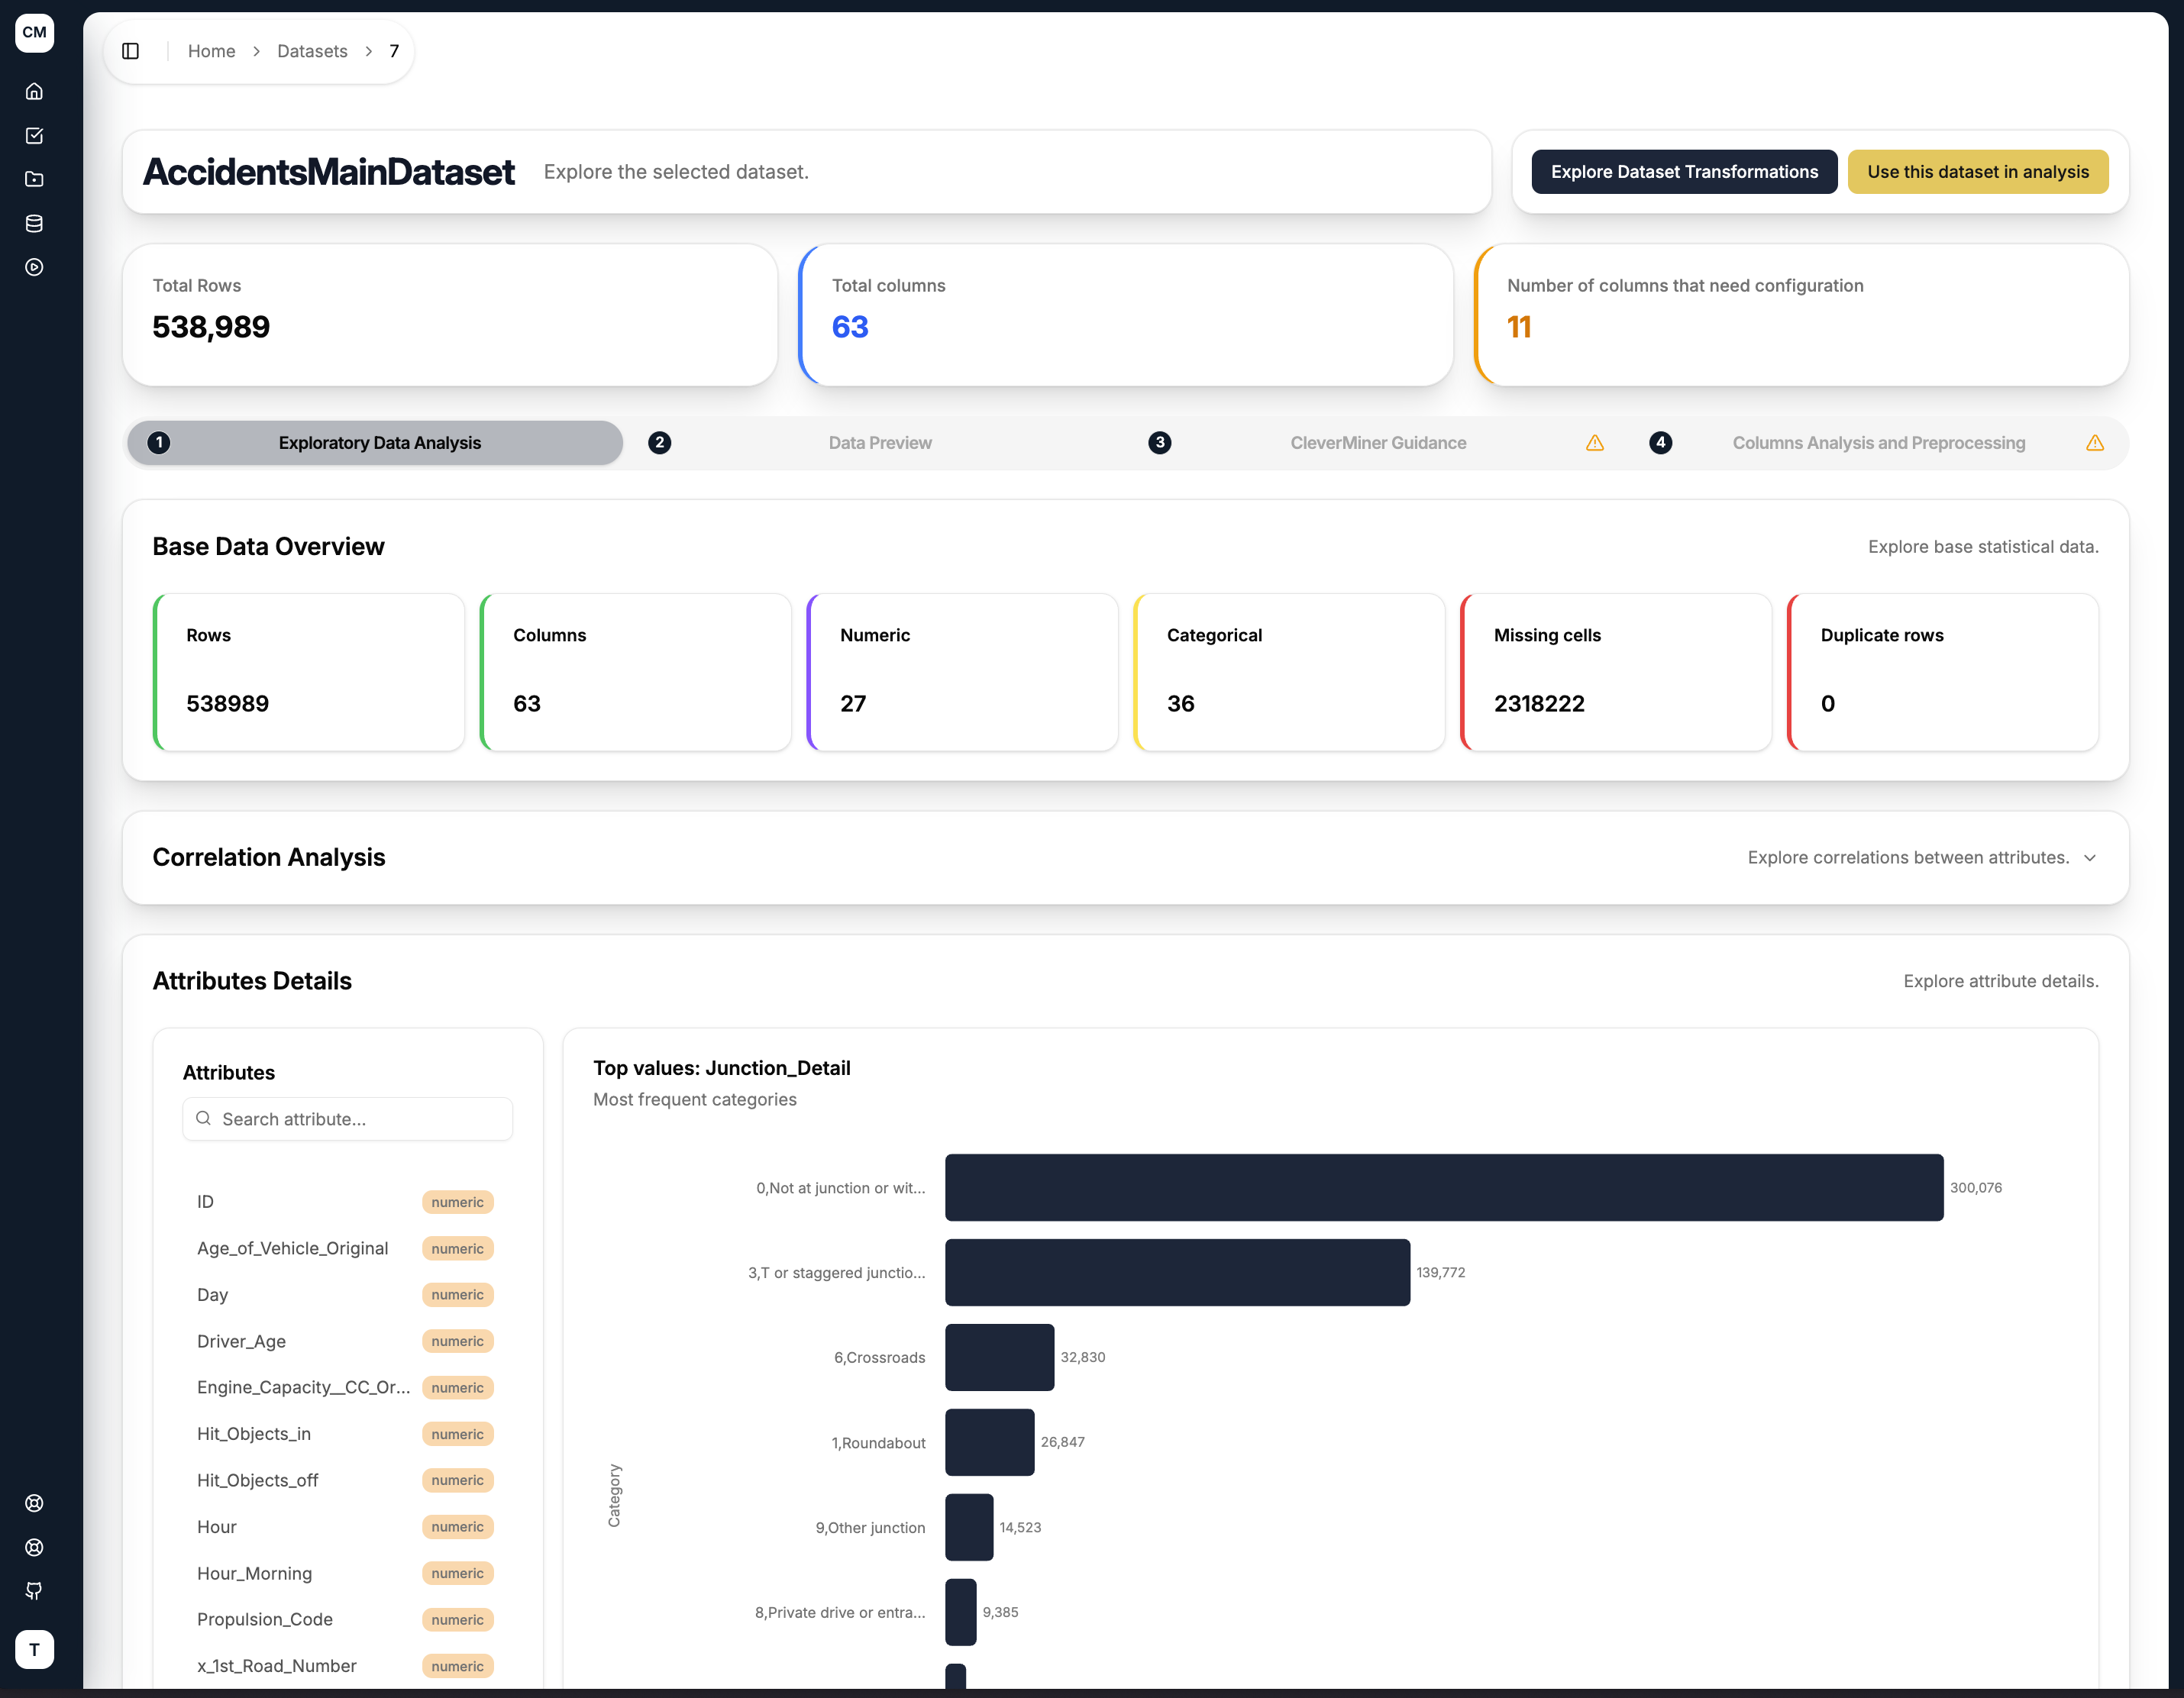
Attributes Details
The Attributes Details section is an interactive column explorer. Select any attribute from the list on the left to view its distribution on the right:
- For categorical columns — a bar chart showing the most frequent categories and their counts
- For numeric columns — an automatically binned histogram showing the value distribution
You can search for a specific attribute by name using the search field above the column list. Each attribute in the list is tagged as either categorical or numeric, making it easy to scan through columns at a glance.